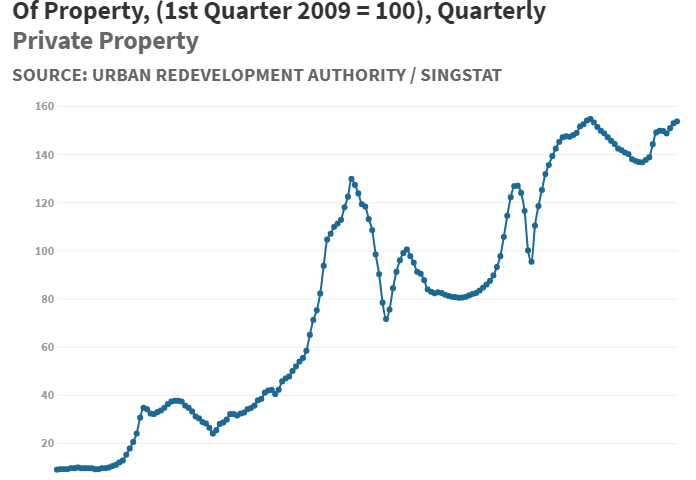
Well, not exactly sure why anybody would need such a prolonged time period of data, but since it’s available in SingStat, we thought – might as well produce an “interactive” chart to display the Property Price Index (PPI) for Private Residential Properties in Singapore (all the way from 1975 until now).
As you hover mouse-over the individual period markers (blue dots), there will be a “popup info” to highlight some of the major events that took place during that time period (which may directly affect the economy, in particular the Singapore real estate industry).
Update FEB2020 – This is still a “works in progress”. You can check back for more updates to the “popup info”. Please verify the Price Index directly via SingStat or URA website. If you discover any errors, kindly let us know via this form.